Businesses comparing Meraki camera models often need more than recorded video. They need a clear picture of how people move through entrances, lobbies, retail floors, hallways, waiting areas, and workspaces. That is where people counting and occupancy analytics become useful. Instead of relying on assumptions, teams can work from measurable movement data collected directly from Cisco Meraki MV cameras.
This matters across many environments. A retailer may want cleaner foot traffic data at the front door. An office may need a better view of lobby traffic and elevator flow. A school may want to track building entry patterns. A healthcare facility may need occupancy trends in public waiting spaces. Cisco Meraki cameras can support those goals when the deployment is built around the right camera type, the right mounting position, and the right analytics method.
People counting with Cisco Meraki MV cameras is built around two different analytics functions: line crossing analytics and area occupancy analytics. Line crossing measures movement across a defined boundary. Area occupancy measures how many people occupy a defined region of interest over time. Both tools are useful, though they answer different operational questions.
Line crossing is the right choice when the business wants to know how many people moved in or out of a defined path such as a doorway, service entrance, stairwell entrance, or elevator bank. Occupancy is the better fit when the business wants to track how full a queue zone, lobby, seating area, or waiting area becomes during a certain time window. Used correctly, these tools create a much better view of foot traffic than raw footage alone.
That distinction matters because poor analytics projects often begin with the wrong measurement method. Entry counting and space occupancy are related, though they are not the same task. A front entrance should usually be measured with crossing lines. A waiting room or lounge should usually be measured with an occupancy area.
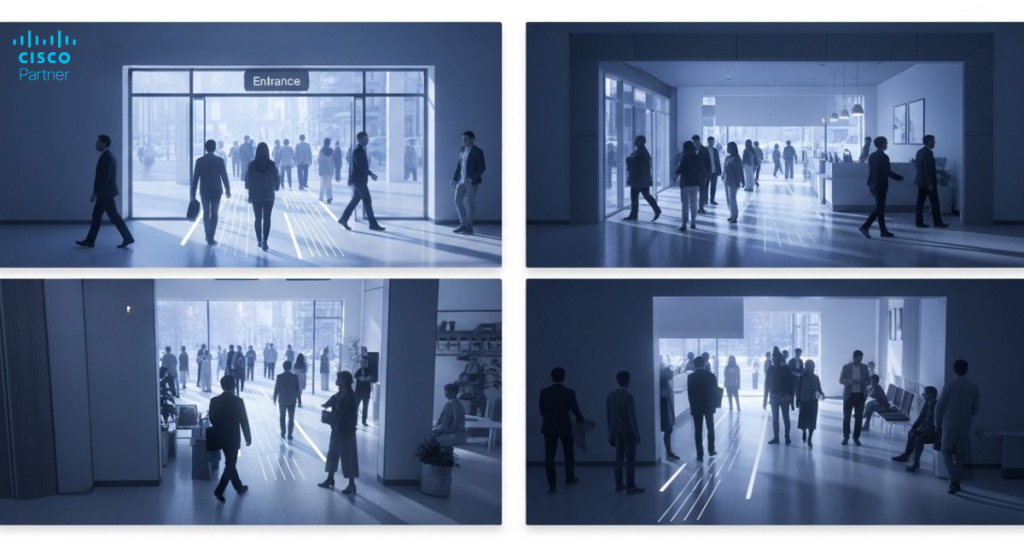
Line crossing analytics count people who pass through a defined line in each direction. When a person crosses in the direction of the arrow, that event is counted as “in.” Movement in the opposite direction is counted as “out.” The line itself is adjustable, which makes it easier to fit a real doorway, corridor opening, or path of movement.
This approach works well at entrances and exits because those spaces create a natural transition point. A front lobby door, a rear service door, a stairwell entrance, or an elevator bank can all act as clean counting boundaries. That makes line crossing especially useful for visitor totals, store entries, employee flow, and building access trends.
A strong line crossing design depends on visibility before and after the crossing point. If a person appears too late in the frame, disappears too early, or gets blocked by an opening door or another object, count quality drops. Entry and exit counting works best when the camera view gives enough space on both sides of the line to capture full movement cleanly.
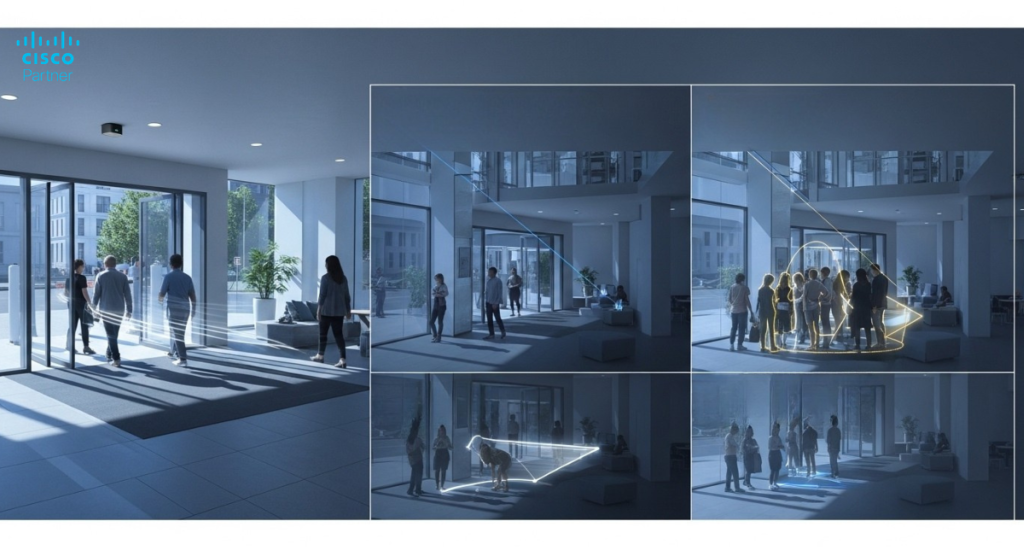
Area occupancy analytics measure activity inside a defined region. Instead of asking how many people crossed a threshold, this method asks how many people were present in a selected part of the frame. It is a better tool for queue areas, waiting zones, service counters, seating areas, and shared interior spaces.
A well-drawn occupancy area should match where people actually stand, pause, or gather. In a reception space, that may be the check-in zone. In a retail environment, it may be the display area that regularly draws customers. In a clinic, it may be the waiting area rather than the entire room. In a workplace, it may be a collaboration corner or a common space.
This is one of the most useful analytics tools for operations teams because it gives them a way to track crowding patterns across time. It can help answer questions such as: when does the queue peak, how long does a waiting area stay crowded, and which part of a space draws the heaviest use? That type of insight supports staffing, layout changes, and service planning without forcing managers to review hours of video.
A camera that is placed poorly will not become accurate because the settings look good. Occupancy and foot traffic analytics depend heavily on camera angle, mounting position, occlusion, traffic density, and lighting quality. If the camera view is cluttered, obstructed, or aimed too loosely, counts become less reliable.
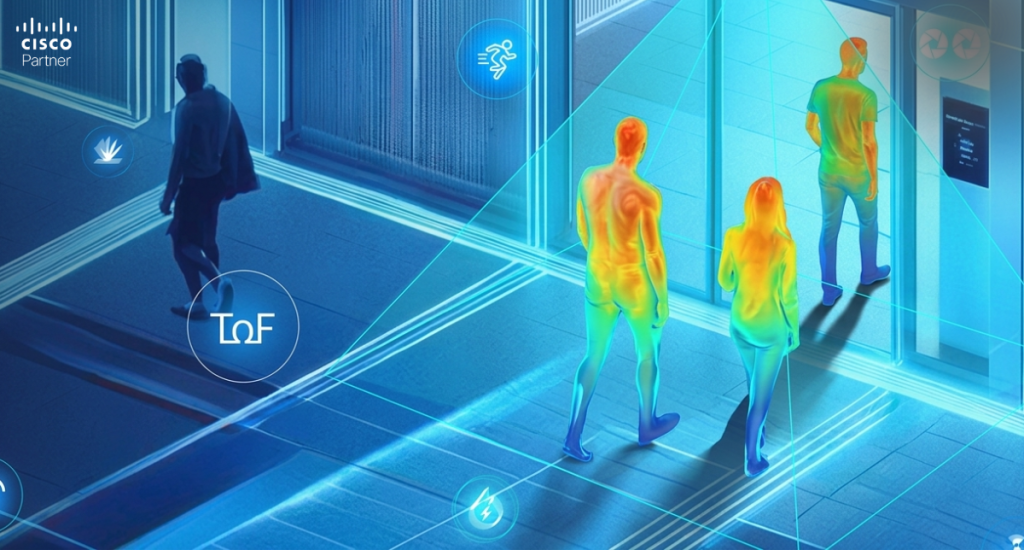
For foot traffic counting, fisheye cameras mounted from the ceiling deliver the best results in many indoor settings. A top-down view reduces overlap between people, which helps the system distinguish individual movement more accurately. Meraki cameras such as MV33 and MV93 are especially well-suited to people counting. Their fisheye form factor provides a wide field of view and reduces occlusion when mounted correctly.
Mounting height matters too. For MV33 and MV93, the strongest range for the Advanced People Counter mode is between 2.5 and 4 meters from the floor. The line or occupancy area should stay near the center of the field of view, and the scene should provide enough free space before a person enters the counted zone. Low light also affects accuracy, with darker scenes producing weaker data.
Dome and bullet cameras can still support line crossing and occupancy analytics, though they require careful aiming to reduce occlusion. They work best when the viewing angle is clean, and the monitored path is easy to isolate. In these scenes, analytics quality depends less on field-of-view size and more on how cleanly people can be separated from each other in motion.
Not every camera in the MV family serves the same analytics role equally well. If the primary goal is accurate foot traffic counting indoors, third-generation fisheye cameras are the strongest fit. MV33 and MV93 support Advanced People Counter mode, which uses a dedicated model optimized for ceiling-mounted fisheye deployments. That is the preferred option for high-accuracy people counting and occupancy work.
Other supported Meraki camera models can still contribute to line crossing and occupancy projects. Dome models such as MV13 and MV63, earlier dome families such as MV12, MV22, and MV72, the MV52 bullet, the MV2 flex camera, and the MV32 fisheye cameras can all support line crossing and area occupancy in the right setting. Their fit relies more heavily on scene design and angle control because they do not support the advanced fisheye people-counting mode available on the MV33 and MV93.
That makes camera choice a planning decision, not a branding decision. If the project centers on indoor footfall accuracy, queue analysis, or lobby occupancy, Meraki camera models with fisheye coverage usually deserve first consideration. If the project centers on a single doorway, a loading path, or a directional corridor view, a dome or bullet model may work well with the right placement.
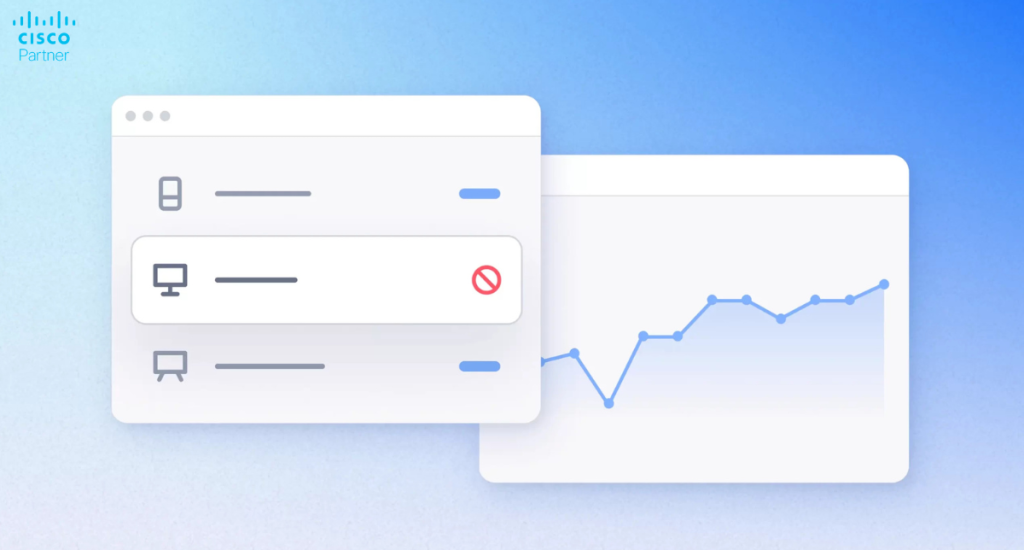
People counting data becomes much more valuable when it reaches beyond the security team. In the Meraki Dashboard, aggregated historical foot traffic data can be reviewed in the Camera > Analytics tab. Each configured line or area can retain six months of data, which gives teams enough history to look for daily peaks, weekly patterns, and longer operational trends. CSV export is available for teams that want to review the data elsewhere or combine it with other reporting.
Retail teams can use line crossing totals to compare store entry by hour or by day. Facilities teams can use occupancy trends to spot crowded waiting areas or underused zones. Office managers can review lobby and elevator bank activity before adjusting staffing or visitor flow. Warehouse teams can look at movement around access points, shipping zones, or service corridors.
The data can also move into custom workflows. Meraki MV presence analytics support REST and MQTT-based outputs, which gives organizations a way to pull line crossing events and occupancy data into building systems, reporting platforms, or custom dashboards. That can be useful in environments that want automated reporting or occupancy-aware workflows.
Simple entry counting is easiest when all access points are on one floor and clearly visible. In that layout, each entrance can be covered by a tripwire, and the building total becomes a clean combination of entry and exit events. More complex buildings need more planning. Multi-floor tenant spaces, shared lobbies, elevator banks, stairwells, and garage-linked entrances can all complicate count accuracy if access paths are missed.
A tenant office, for example, may not control the main lobby. In that case, every external-facing entrance to the tenant space has to be covered by tripwires. That may include elevator bank entrances on each floor, stairwell doors, or connected garage access points. The diagrams in the uploaded people-counting reference show this clearly by mapping tripwire coverage to outer-wall entrances in simpler buildings and to elevator and stairwell entry points in more complex tenant layouts.
Multi-floor projects often need a short planning workshop before deployment. The camera layout has to match the true movement paths, not the floor plan that looks simplest on paper.
The most common problems are predictable:
Occlusion is one of the biggest sources of bad data. If people overlap heavily or objects interrupt the view at the crossing point, the count can drift. Low light creates another problem. Darker scenes reduce confidence in object detection. In fisheye deployments, incorrect mount height can also distort results because the counting model depends on that geometry being accurate.
Occupancy monitoring and foot traffic counting can add real value to a Cisco Meraki camera deployment when the project starts with the right question and the right camera placement. Line crossing analytics work best at thresholds and controlled movement paths. Area occupancy works best in waiting spaces, queue zones, and shared interior areas. The strongest accuracy for indoor counting usually comes from ceiling-mounted fisheye deployments, especially with MV33 and MV93.Businesses comparing Meraki camera models should treat analytics quality as a core part of the decision, not an extra feature to revisit later. Stratus Information Systems helps organizations design Cisco Meraki camera deployments that support stronger security visibility, better operational reporting, and cleaner long-term value from the camera system.