
Cisco Meraki provides organizations with the technology and platform for streamlining the security and management of their Internet-connected devices, WiFi networks, routers, switches, firewalls and other meraki cloud platform services. The Meraki Dashboard is a cloud networking solution that enables centralized, remote management of network devices, allowing IT teams to configure, control, and monitor their infrastructure without the need for physical access. It also delivers real-time insights from devices, smart cameras, and sensors, and is designed for scalability across organizations around the world.
Meraki is famous for its centralized approach to security management and cutting down time and costs for deploying security configurations across networks – no matter where they are located in the country or abroad.
The Meraki Dashboard brings a high level of ease to network administrators’ daily life, simplifying their work by making network management more user-friendly and efficient.
These are all possible through the Cisco Meraki Dashboard, which offers a new way for organizations to manage their networks globally.
The Meraki dashboard is a web browser-based tool that serves as the central place for managing all network devices, including cameras and sensors, allowing IT registrators to supervise hundreds of networks and devices effortlessly through the cloud, using only one device. Meraki dashboard has a user-friendly interface and easy-to-understand navigation design, making it ideal for all organizations, including non-tech niches.
IT registrators can easily handle configuration, monitoring, and management of networks through the Cisco Meraki dashboard. The dashboard guides users through each step of device setup and management, streamlining processes such as SSO integration and device pre-configuration. For example, an administrator can use the dashboard to configure a camera or sensor, setting up alerts and monitoring real-time data from a single interface. It is a complete, holistic IT infrastructure actively overseen by a dedicated product enablement team at the Cisco Meraki headquarters. Upon mastering its tools and features, businesses should be able to improve their day-to-day operations significantly. The Meraki Dashboard provides a graphical user interface for managing Wi-Fi, switching, cameras, and security appliances.
Before we begin, let’s clear some terminologies that will be used for the rest of this article:
Cisco Meraki devices make up a network; one or more networks make up an organization and an registrator account can have “full” or “read-only” access to networks and organizations. The Meraki Dashboard provides visibility and manageability from the Internet edge to access point clients and CCTV cameras.
Keeping these terms in mind, let’s now discuss how the Meraki dashboard works.
Users must be registered as administrators and permitted to view the dashboard according to their rank or work responsibilities. To enable single sign-on (SSO) with Microsoft Entra ID, you must first sign in to the Microsoft Entra admin center as at least a Cloud Application Administrator. Computers can also be included in the SSO and access configuration process.
Who can create a Meraki dashboard login for a user? Organization-level administrators with full or read-only access can view the list of administrators in the organization. However, only organization-level admins with full management access can make any changes on the page – add an, delete an, or change the access privileges of current admins.
To integrate Meraki Dashboard with Microsoft Entra ID, you need to add Meraki Dashboard from the gallery to your list of managed SaaS apps. You must also establish a link relationship between a Microsoft Entra user and the related user in Meraki Dashboard for SSO to work. During SSO configuration, users may need to select the appropriate options and enter critical values such as URLs, thumbprint values, and role details. When configuring access privileges, ensure you enter the correct SAML assertions and attribute mappings as required by Meraki Dashboard. You also need to copy the Thumbprint Value from the SAML Signing Certificate section and convert it to include colons for the Meraki Dashboard to understand it.
Full-access organization admins only have to input a new administrator’s name and email address to generate their Meraki dashboard login credentials. Since it is so easy to set up administrator access, businesses and companies must observe SOPs and best practices in deciding who gets this level of control.
Senior IT technicians typically get full organizational access, while junior employees get full or read-only access to certain networks. Bear in mind that the organization has the highest level of control and should, therefore, be trustworthy and reliable.
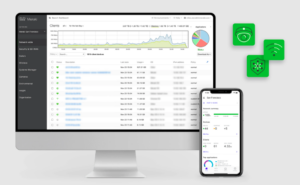
The homepage of the Meraki dashboard shows the Organization Summary at the top. It offers an overview of the overall health of the entire organization, including the ability to monitor Meraki access, WAN, and IoT technologies together. If one or more networks have trouble, registrators will immediately know from the homepage.
The first section shows Device health information: summaries of online and offline devices in each network along with colored indicators (red for offline and green for online). This includes not only traditional network devices but also IoT devices, providing a comprehensive view of your infrastructure.
Below that is the Network section which shows a list of all networks with summarized data usage, clients, tags and other relevant information. Administrators can click on each network for a more detailed look at its status and other information, including WAN and IoT device performance.
As you navigate the other pages and tabs, you’ll also find easy-to-understand graphs showing network and device health across different parts of the network. The dashboard enables real-time insights from security cameras and sensors, allowing administrators to quickly respond to events and monitor IoT deployments at scale.
Another useful page that offers a quick look at network-wide health is the Topology page. It shows a visual diagram of how the networks within an organization are interconnected. If you hover over a network, it will show the real-time number of ports, clients and the current uplink speed of that network.
On the left side of cisco meraki dashboard is the navigation bar or menu. Its tabs will take you to internal pages where users can find more in-depth data and status updates for every network and Meraki product in the organization
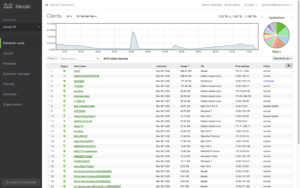
Take a look at a screenshot of the Client page below. It shows a list of clients under a network in the organization. It provides a table with other information such as current active users, dates users last logged into the network, their current connection status (online or offline), data consumption, device type and more.
These pages, with extensive, detailed information about all products and devices within the network and organization, are valuable to technicians in charge of network registration. By providing real-time and historical data, cisco meraki dashboard alerts registrators of potential problems and allows them to take preventive measures to prevent downtime and other bigger problems.
All Meraki hardware and cloud services require licenses to be operational. Organizations can choose to buy 3, 5, 7 or 10-year licenses at a time and follow one of two licensing options:
Administrators with full access to the network or organization can take charge of Meraki dashboard license updates. They need to track license expiration dates (remember that in a PDL licensing format, registrators track the expiration dates of every piece of licensed Meraki hardware and software).
The good news is whether your licensing format is PDL or Co-term, keeping up with Meraki Dashboard license updates won’t take much time and effort. There’s no need to manually install software or the devices because the license activation is all done through the cloud.
One of the most impressive features of the Meraki dashboard is its ability to give registrators a macro and micro view of the entire organization. Administrators can go from a global view of the dashboard down to an entry point device in a building where you’ve set up an office overseas.
From the global view, registrators can be alerted to possible issues thanks to the color-coded status icons:
The location icons from the global map represent an aggregate of networks located within a specific geographic area. Administrators can click on one node to zoom into a region and again to zoom into a city, a neighborhood, down to a building or individual device view.
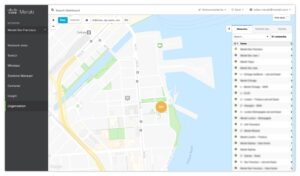
Administrators can view individual access points to troubleshoot or review data from this micro view. Users can also upload office floor plans, which would specify the exact physical location of the access points and the devices connected to the network.
The Meraki Dashboard automatically monitors and manages network health information as soon as smart devices connect, providing real-time insights that enhance operational efficiency and safety. Clicking on any of these access points will show more individual data, such as the device’s IP address, channels, the switchboard they’re connected to and the clients connected to the access point. Moreover, regs can see how long onsite users were logged in, how much data they consumed, their devices, where they stayed in the office and even the apps and websites they used.
Indeed, registrators with full access to networks and organizations become privy to the smallest details of all devices and users registered in the Meraki Dashboard. The historical information and real-time access to all devices and clients provide valuable insights that allow IT teams and the management to:
Thanks to the Meraki dashboard, businesses and companies can do more with the information at their fingertips.
Besides monitoring and management, the Meraki dashboard is most helpful in deploying configurations throughout an entire network or organization in just a few clicks. Configuration can be performed in a few simple steps, including cloning or templating networks for easy deployment across multiple sites.
Remote, no-touch device configurations save organizations thousands of dollars every year. There’s no need for IT technicians to go to an office location to install security protocols, troubleshoot or configure operational and security settings. Everything can be done on the cloud through the dashboard. Once you configure Meraki Dashboard, you can enforce session control to protect sensitive data in real time. Meraki integration can also be configured as either a scan probe or a connector task to sync data.
Here are examples of what remote deployments can do:
For example, to perform a network clone or template deployment, you can follow each step in the Meraki Dashboard to quickly replicate settings from an existing network to new sites, ensuring consistent configuration and saving time during large-scale rollouts.
The Meraki Dashboard is designed to make network management intuitive and efficient, bringing all your network assets together in one location. The left-hand device overview panel provides instant access to all connected devices, including security appliances and wireless access points, allowing administrators to quickly navigate between different parts of the network. In the center of the dashboard, live statistics and real-time data on device and client activity are displayed, giving you immediate insight into network health and performance. This streamlined layout enables IT teams to identify and troubleshoot issues as they arise, reducing downtime and ensuring that your business stays connected. With the Meraki platform, managing your entire network from a single, cloud-based interface not only simplifies day-to-day operations but also helps reduce costs and improve overall network management efficiency.
Managing devices with the Meraki Dashboard is both powerful and straightforward. The platform allows you to remotely access, configure, and control a wide range of devices—including security appliances, wireless access points, and switches—without the need for on-site intervention. Devices can be pre-configured in the cloud, so when they are deployed at a new site, they automatically download their settings and are ready to go, saving valuable time and resources. You can also create device groups to apply consistent settings and configurations across multiple devices at once, ensuring uniform security and operational policies throughout your organization. This centralized approach to device management not only reduces costs but also enhances your ability to maintain secure, up-to-date configurations across all locations, making it easier to scale and adapt as your business grows.
The Meraki Dashboard offers a comprehensive client view, giving you real-time visibility into every device connected to your network. From the Monitor tabs, you can access detailed information about client health, bandwidth usage, and performance metrics, helping you understand how your network is being used and by whom. The platform also allows you to configure automated alerts for specific network events, so administrators are notified immediately if issues arise. This proactive approach enables your team to stay ahead of potential problems, troubleshoot quickly, and ensure a seamless experience for all users. With the Meraki platform, you can enjoy the confidence that comes from having complete, real-time visibility and control over your network environment.
The Meraki Dashboard is equipped with a robust suite of troubleshooting and support tools designed to help you resolve issues efficiently. Built-in troubleshooting guides and diagnostic features make it easy to pinpoint and address problems, while integrated alerts and notifications ensure that potential issues are brought to your attention before they impact your business. The platform also provides access to a wealth of online support resources and an active community forum, so you can find answers and best practices quickly. For organizations with more complex needs, Meraki’s integration capabilities allow you to connect with third-party tools and services, expanding your support options. By leveraging these comprehensive troubleshooting features, the Meraki platform helps you minimize downtime, maintain optimal performance, and ensure your network remains secure and reliable.
To fully leverage the power of the Meraki platform, it’s important to adopt best practices and continually optimize your network settings. Regularly updating firmware and software ensures your devices remain secure and benefit from the latest features. Monitoring network performance and analyzing usage data with Meraki’s built-in analytics tools allows you to make informed, data-driven decisions to enhance efficiency and security. Adjusting configurations as your business needs evolve helps you stay ahead of potential challenges and maintain a high-performing, secure network. By creating a tailored network management plan and utilizing the platform’s advanced features, you can ensure your organization’s network is always ready to meet current requirements and future demands. With Meraki, you have the tools to build a secure, scalable, and optimized network that supports your business goals.
All businesses today use the cloud and Internet networks in some form or another, whether in running their day-to-day operations or fulfilling service requests and client orders. As such, it is crucial to have a robust IT infrastructure that’s easy to manage and configure according to your business needs. The Meraki Dashboard supports the management of networks from campus to branch, providing flexibility for organizations of all sizes.
At Stratus Information Systems, we guide you through every step of your journey to adopting the Meraki Dashboard for network management, ensuring your organization is supported as your needs evolve.
Our specialists at Stratus Information Systems will be happy to tell you more about Cisco Meraki, its dashboard, and how your business can benefit from them. Learn how to configure and test Microsoft Entra SSO with Meraki Dashboard—including how you can test your configuration by selecting “Test this application” for automatic sign-in, and use Microsoft My Apps for seamless access.
Contact us today to request a demo and free trial of the Cisco Meraki dashboard.