Wireless connectivity issues aren’t always visible from the top down. The network might look healthy, and monitoring logs may show no alerts, yet users still face authentication failures, dropped sessions, or roaming interruptions. These silent issues are common in busy offices, campuses, and retail spaces, especially when client density fluctuates or when users are spread across many SSIDs.
Meraki Wireless Health gives IT teams immediate insight into these problems. Built into the Meraki Dashboard, it analyzes the end-to-end wireless experience by inspecting how individual clients connect, authenticate, roam, and maintain performance. With wireless health enabled, network administrators can locate failure points in seconds and take proactive steps before tickets start flowing in.
At Stratus Information Systems, we help organizations deploy and optimize Cisco Meraki solutions, including Wireless Health configuration, anomaly detection, and root cause resolution.
Wireless Health Meraki is a native diagnostic engine that correlates client connection data and performance metrics. It measures wireless reliability by evaluating each connection step, from the initial handshake with an access point to traffic flow confirmation.
Instead of looking only at logs or SNMP alerts, administrators can see how real clients experience the network. Meraki Wireless Health highlights where and why connection attempts fail and which access points or SSIDs are contributing to those failures.
This tool is valuable for rapid troubleshooting and performance optimization. With Wireless Health, IT teams spend less time sifting through logs and more time fixing issues that matter. It also helps prove or disprove root causes during vendor escalations, user complaints, or device updates.
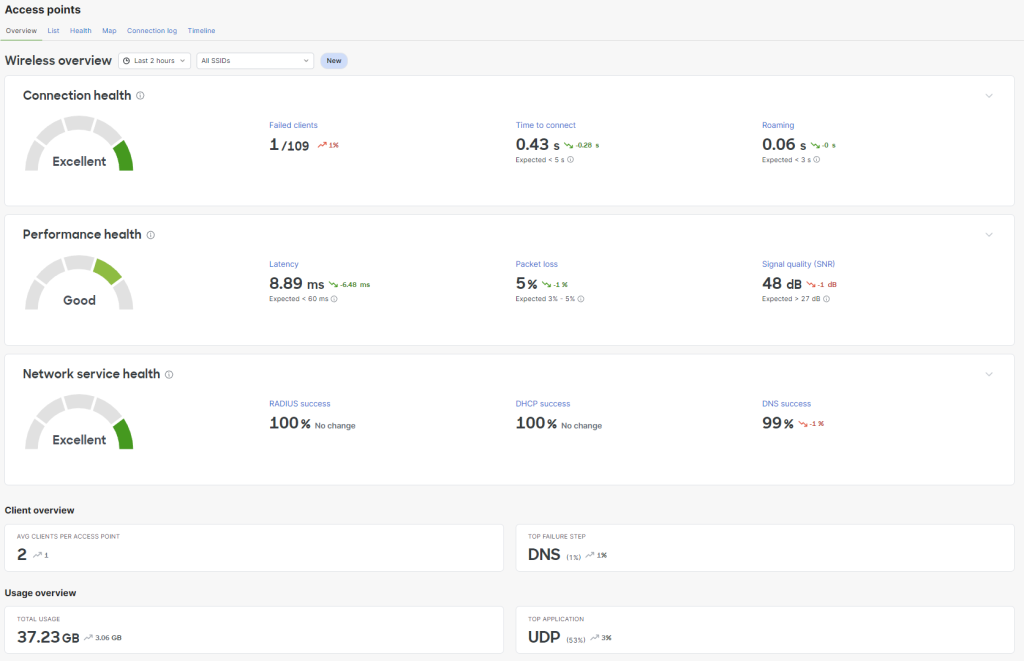
The Wireless > Monitor > Overview tab is the command center for wireless analytics. It displays real-time and historical performance data, broken into two key sections: Connection Health and Performance Health.
Connection Health tracks failed connection attempts and highlights the most impacted SSIDs, clients, and access points. It offers a clear percentage of success and visual timelines, helping administrators isolate changes that coincide with connection problems.
Performance Health focuses on signal quality and traffic stability. It analyzes SNR (signal-to-noise ratio), latency, and packet loss. Together, these indicators show how well clients maintain connections after onboarding.
Meraki’s Dashboard uses machine learning to establish baselines and surface deviations. It shows trends over two-hour, daily, or weekly views, making it easier to spot performance regressions. This feature benefits dynamic environments like stadiums, schools, and large office buildings.
Every wireless connection consists of multiple steps. Meraki Wireless Health breaks these down into five phases: Association, Authentication, DHCP, DNS, and Success. If a client cannot progress past one of these steps, the system flags it immediately.
The Connection Steps Graph is a visual summary showing where most clients struggle. For instance, if many clients fail at DNS resolution, this might suggest an upstream DNS server issue or misconfiguration in DHCP options.
Administrators can filter the data by SSID, access point, or time window. Connection failures can then be traced back to specific hardware or user groups. The graph also makes it clear if a failure affects one area or spans the entire network.
Each failure is color-coded, and drop-offs are easy to spot. This approach minimizes guesswork and shortens the time from problem detection to resolution. It’s especially helpful when investigating intermittent issues that don’t show up in traditional device logs.
Beyond basic connectivity, wireless performance defines the end-user experience. Meraki Wireless Health evaluates performance through three core KPIs: latency, packet loss, and signal quality (SNR).
High latency can indicate RF congestion, backhaul bottlenecks, or misconfigured QoS. The system flags APs or clients with an average latency of more than 60 milliseconds. Packet loss above 3 percent also raises a warning, signaling potential coverage holes or interference.
SNR is a key indicator of RF quality. The system highlights clients and APs with SNR below 27dB, pointing to coverage or capacity issues. These metrics are updated in real-time and stored for historical trending.
Performance Health also identifies impacted devices, so you know if the problem is affecting a single phone, an AP zone, or a campus-wide SSID. This level of detail supports fast triage and smarter long-term planning.

The Access Points > Health tab gives a comprehensive view of client and access point behavior. It consolidates data across all SSIDs and highlights top sources of failure.
From this tab, you can drill into:
Each view is filterable by time, SSID, and client count. The dashboard also includes a success rate trendline, allowing you to track recovery after configuration changes or firmware upgrades.
You can hover over any AP or client and see details on failure rates, latency, and signal quality. This transforms troubleshooting from reactive to proactive and makes it easier to correlate field complaints with actual metrics.
Meraki Wireless Health includes smart anomaly detection, powered by historical baseline analysis. The dashboard compares current onboarding metrics against trends from the previous six weeks and flags any deviations.
These anomaly graphs highlight when connection steps exceed expected thresholds. For instance, if DHCP times spike for an SSID that was historically stable, the graph will surface that as an anomaly and link it to affected clients.
Thresholds adjust automatically as environments evolve. This is especially useful in seasonal businesses, shared venues, or during network-wide upgrades. Admins can receive email notifications for anomaly detection, keeping them informed of hidden problems before they escalate.
To get granular, step-by-step detail on connection failures, Meraki Wireless Health offers the Connection Log and Timeline views. These tools allow administrators to analyze every failed client connection attempt across the entire network.
The Connection Log lists each failure event by:
This log is fully filterable by SSID, access point, client device, and failure reason. Clicking any entry opens the client’s detailed connection timeline, allowing you to trace root causes over time easily.
The Network Timeline view shows broader patterns. It visualizes aggregate client connection events, both successful and failed, across the selected period. This high-level view highlights spikes in problems, often revealing the impact of firmware updates, RF interference, or server issues.
Both tools are indispensable for IT teams managing large or distributed wireless environments. They allow rapid isolation of root causes without needing to cross-reference separate systems or perform deep packet captures.
One of the most powerful features in Meraki Wireless Health is its ability to detect and attribute server-related failures. Many wireless onboarding issues stem from upstream systems like RADIUS, DHCP, or DNS servers. Meraki’s intelligent server RCA engine tracks these dependencies and surfaces them in the Dashboard.
Examples include:
The system collects evidence of similar failures across SSIDs and VLANs to improve confidence in the diagnosis. These insights are shown directly on the Access Point’s or Client’s timeline.
With this level of visibility, administrators can confidently escalate to the right system owner or make informed configuration changes. It’s one of the fastest ways to reduce MTTR and validate wireless network health beyond RF metrics.
Wireless environments are never static. As client density increases and new applications emerge, optimizing performance becomes a continuous task. The Wireless Health Meraki platform includes a peer benchmarking feature that helps administrators stay ahead.
This tool compares your network against others of similar size and vertical using three key metrics:
These comparisons provide context. If your network is underperforming but broadcasting more SSIDs than average, that may be a contributing factor. Likewise, if most of your clients are connecting on 2.4 GHz despite having dual-band capability, it could indicate a misalignment in client steering or band selection.
The benchmarking feature includes actionable recommendations and updates weekly, giving you fresh insights as your network grows.
Wireless Health is ideal for organizations that require real-time visibility and efficient troubleshooting. Here are just a few practical scenarios where it makes a measurable impact:
In large buildings with hundreds of users moving across floors, Wireless Health helps diagnose roaming inefficiencies and identify APs with delayed authentication or DHCP response.
In retail, stadiums, or auditoriums, client counts can change rapidly. Wireless Health helps track performance degradation caused by crowding, RF interference, or configuration oversights. The anomaly graph helps spot shifts when those environments reach capacity.
Schools and universities support diverse device types and bring-your-own-device environments. Wireless Health helps identify which devices struggle most and which SSIDs or APs need better tuning.
Each use case benefits from the proactive alerting, anomaly detection, and historical analysis that Wireless Health brings to the Meraki platform.
To get the most from Meraki Wireless Health, consider these best practices:
Wireless Health works best when used as part of a broader monitoring strategy, supported by structured alerting and documented troubleshooting workflows.
Meraki Wireless Health transforms how IT teams manage Wi-Fi. Instead of reacting to helpdesk tickets or manually checking logs, you get real-time insights into client behavior, performance trends, and infrastructure health. With its rich analytics and intelligent root cause detection, Wireless Health empowers teams to diagnose issues in seconds, not hours.
At Stratus Information Systems, we help organizations deploy, monitor, and fine-tune Meraki solutions to get the most out of Wireless Health. From implementation to troubleshooting automation, our certified experts deliver results.
Looking to make your Meraki wireless network faster, smarter, and more transparent? Contact Stratus Information Systems today.