

Network reliability and security are always business-critical. That’s why IT teams must constantly monitor, audit, and adjust infrastructure to keep users connected and data protected. Achieving this requires more than just performance monitoring—it demands full network visibility. That includes knowing exactly who made what changes, when, and how those changes impact operations.
Meraki’s Configuration Change Timeline, built into the Cisco Meraki dashboard, offers IT administrators a transparent, real-time history of all configuration changes across the network. It transforms change tracking from a manual, error-prone task into an automated, centralized system. Whether troubleshooting outages, meeting compliance requirements, or securing the network, Meraki’s configuration timeline adds an essential layer of control and insight.
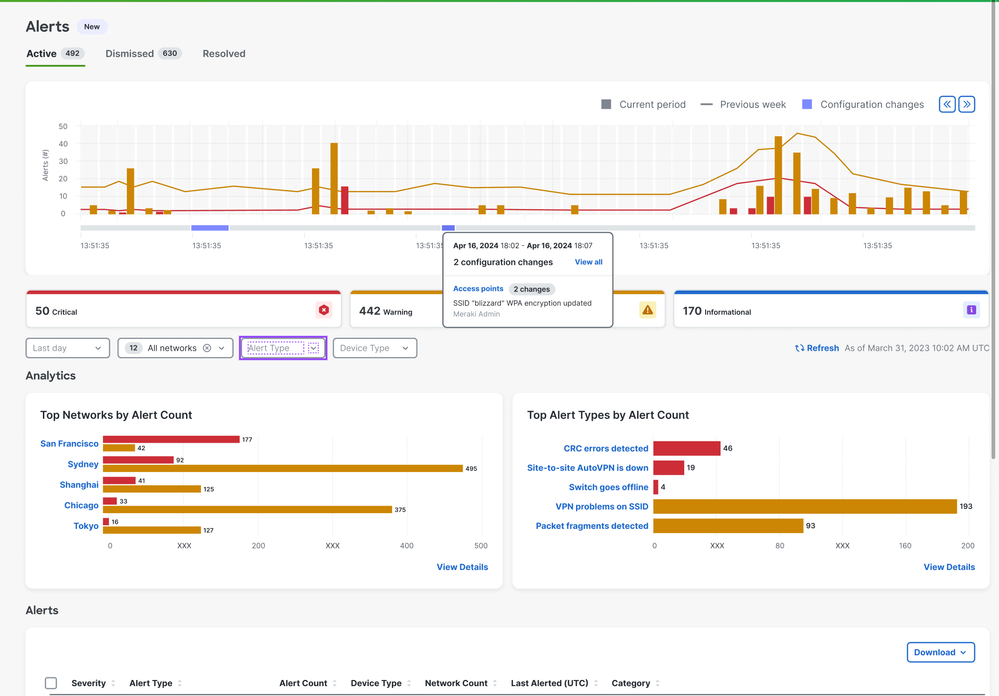
The Meraki Configuration Change Timeline is a powerful tool within the Meraki dashboard that tracks and logs every change made to network configurations. Whether adjusting firewall rules, updating SSIDs, or modifying VLAN assignments, every action is timestamped, categorized, and attributed to the specific user who made it.
This timeline includes changes across Meraki switches, access points, firewalls, cameras, and other managed devices. Commonly logged items include port configurations, SSID updates, security rule changes, firmware upgrades, and group policy adjustments. Every entry is clearly labeled for fast review.
This level of granularity is invaluable for IT admins. Instead of guessing when a setting was changed—or who changed it—they can review a comprehensive audit trail in seconds. The timeline adds a layer of accountability and ensures that no configuration goes unnoticed.
Every change made through the Meraki dashboard is recorded in real-time. This includes both automatic changes—like firmware updates—and manual ones made by admins. The Meraki configuration timeline ensures no update slips through the cracks. With this visibility, teams can trace issues directly to the moment a modification was made.
The Configuration Change Timeline simplifies troubleshooting by revealing the exact sequence of changes leading up to a problem. Instead of combing through logs or recreating past settings manually, admins can use the historical data to identify misconfigurations or revert to previously working settings. This feature significantly reduces downtime and accelerates issue resolution.
For businesses subject to strict compliance standards, having a detailed change log is essential. The timeline helps organizations maintain compliance with frameworks like HIPAA, PCI DSS, and SOC 2 by providing verifiable records of configuration changes. It also enhances internal security by creating accountability and reducing the risk of unauthorized or undocumented changes.
Managing multiple sites is easier with Meraki. The Configuration Change Timeline supports multi-network environments, allowing admins to view changes across locations from a single dashboard. This is especially useful for distributed enterprises, MSPs, and organizations with remote branches that need centralized control and visibility.
To access the Meraki configuration timeline, log in to your Meraki dashboard. Navigate to the organization or specific network you want to inspect. Under “Organization > Change log” or within device-specific settings (like switch or firewall), you’ll find a chronological list of all configuration events.
The dashboard includes powerful filtering tools that let you narrow down results by device type, user, or date range. You can also search by specific settings, such as SSID name, VLAN ID, or port number. This helps quickly pinpoint relevant changes, especially during troubleshooting or audits.
Each log entry includes the user’s email, the exact timestamp, and a brief description of the change. Clicking the entry often reveals additional context, such as before-and-after values. This makes it easy to understand the impact of a change and determine whether further investigation or rollback is needed.
Review the Configuration Change Timeline as part of your daily network monitoring routine. Assign role-based permissions to restrict who can make changes, and establish change approval workflows. Document key changes and align them with internal processes to ensure smooth network operations.
Large organizations rely on the Meraki configuration timeline to ensure policy enforcement across multiple teams. It provides a single source of truth when multiple admins manage the same environment. Enterprises also use the timeline to verify compliance, document changes for audits, and avoid finger-pointing during troubleshooting.
MSPs benefit greatly from this feature, as it allows them to track client network changes remotely. If a customer experiences an issue, the MSP can immediately check the change history to identify recent updates. This supports faster issue resolution and increases customer satisfaction without requiring onsite visits.
In fast-paced retail and hospitality environments, uptime is everything. The Configuration Change Timeline ensures network stability during high-traffic periods by making it easy to track adjustments, identify missteps, and maintain optimal configurations across Wi-Fi, point-of-sale systems, and guest networks.

Traditional logging often involves third-party tools or manual notetaking, which introduces delays and inaccuracies. In contrast, Meraki’s built-in timeline offers an intuitive, user-friendly interface that centralizes all change data. There’s no need to install external software or configure complex syslog servers.
Businesses choose Meraki for its efficiency and automation. Instead of parsing dense log files, admins get readable, real-time updates in just a few clicks. This reduces human error, accelerates diagnostics, and supports compliance—all from the cloud.
Admins can configure email or SMS alerts for critical changes—such as firewall updates or SSID modifications. This ensures network teams are notified immediately when significant configurations occur, allowing for faster response to unintended changes or breaches.
Pair the Configuration Change Timeline with features like event logs, security alerts, and traffic analytics for a complete view of network behavior. This layered insight helps correlate changes with performance issues, security events, or policy enforcement outcomes.
At Stratus Information Systems, we specialize in helping organizations get the most out of Cisco Meraki solutions. From onboarding and configuration to training and support, our experts guide you through every step of your Meraki journey. Whether you’re deploying a single site or managing multiple networks, we ensure your configuration management is secure, efficient, and optimized.
Want to take full control of your Meraki environment? Contact Stratus Information Systems today for expert consultation, licensing, deployment, and long-term support for your Meraki-powered network.


