If you manage physical locations, you already know the blind spot. Digital teams see clicks, bounce rates, funnels, and conversion paths. On-site teams often rely on door counters, manual headcounts, or just gut feel. As locations grow and staffing gets tighter, those gaps show up fast. Lines form in the wrong places. High-value areas sit underused. Peak periods catch teams unprepared. This is why foot traffic analysis has moved from “nice to have” to an operational necessity. With modern Wi-Fi analytics, the network can reveal how people move through spaces, where they pause, and when demand spikes, without asking visitors to install an app or scan a QR code.
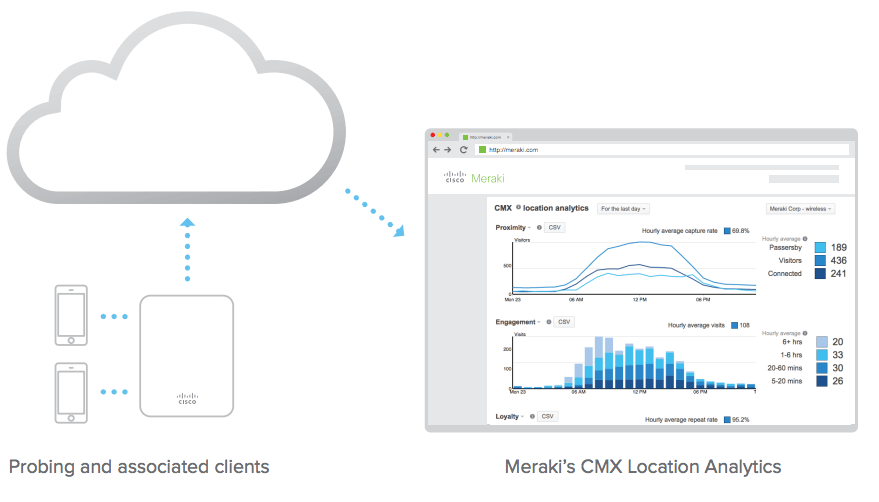
Meraki location analytics gives operations and IT teams a practical way to turn wireless signals into location-based analytics that support smarter decisions. Instead of guessing, teams can work with real-time location data to improve layout, staffing, safety, and experience. The goal is not to “track people” in a creepy way. The goal is to measure patterns inside smart spaces so leaders can manage capacity, reduce congestion, and plan with confidence. For larger estates, campus analytics can bring consistency across multiple buildings and sites. Stratus Information Systems helps teams design Meraki wireless environments that support analytics without adding complexity.
A wireless device “talks” even when it is not connected. Phones and laptops send discovery signals as they look for networks. Meraki access points can observe those signals and record that a device was near a specific radio at a specific time. On its own, that data is noisy. People walk past the building. Devices pause briefly at the entrance. Some devices randomize identifiers. Good analytics systems filter, normalize, and aggregate those signals so teams get usable insight.
That is where location-based analytics becomes valuable. Instead of focusing on individual devices, the platform focuses on patterns. How many devices were near the storefront this hour. How many moved deeper inside. Where dwell time increased. What repeat visitation looks like across days.
When done properly, the output supports operational decisions instead of generating “pretty charts” with no next step.
Most teams start with the same questions, then mature over time. The foundational metric is volume: the number of devices detected within a defined area. Next comes classification: which devices look like passersby and which look like visitors. Then engagement: dwell time and frequency. These metrics bring structure to foot traffic analysis. They help separate a busy sidewalk from a busy store and separate quick transactions from high-engagement visits.
In practice, the most useful metrics tend to be trend-based. Compare weekday versus weekend patterns. Watch how peaks move when a tenant changes. Track how long queues persist after a schedule change. Pair traffic volume with dwell time and you can spot friction that basic counters miss. A door counter can say “200 entered.” It cannot say “60 stayed under two minutes because lines were too long.”
When data is well structured, it supports real operational questions.
Which zones attract people but fail to hold them?
Which areas stay crowded and need different routing?
When does demand exceed staffing capacity?
Where do visitors linger and need signage, seating, or service points?
These questions sit at the center of occupancy monitoring, especially in environments where safety and experience matter.
For distributed organizations, patterns across sites are often more valuable than any single building insight. That is where campus analytics becomes practical. You can compare building-to-building behavior, identify seasonal cycles, and validate changes across a portfolio. The network becomes a measurement layer that helps leaders run spaces with the same discipline used in digital operations.
Meraki wireless access points can detect devices through wireless scanning. Wi-Fi detection is the baseline, since most devices broadcast discovery traffic. Bluetooth Low Energy can add signal sources in environments where BLE devices are present. The point is not that every device will be detected. The point is that enough signals exist to produce reliable aggregate trends when the deployment is designed correctly.
Detection quality depends on radio coverage and consistency. If your environment has dead zones, analytics will reflect that. If access points are placed only for coverage in work areas, you may miss entrance flows or waiting zones. This is why analytics should be considered during wireless design, not added as an afterthought. You do not need “exotic” hardware, but you do need deliberate placement.
Once signals are collected, they are processed into time-based observations. That is where real-time location data becomes useful. Real-time does not mean “per-second precision for every device.” It means the system can show what is happening now, using consistent thresholds and filtering. A brief appearance can be treated as a pass-by. A longer presence can be treated as a visit. Repeated presence across days can signal repeat engagement.
Classification quality comes from thoughtful settings and realistic expectations. For example, a busy corridor will produce many short detections. A lobby will show a longer dwell time. The system should help you interpret those patterns, but your team still needs to define what “engagement” means in your context. Retail teams define engagement differently from universities. Warehouses define it differently from event venues.
Trend analysis is where analytics becomes operational. Real value shows up when teams can review hourly patterns, compare days, and spot seasonal shifts. That supports staffing, scheduling, and space planning. It also supports incident review. If a location had service disruptions, analytics can show how visitor behavior changed during the event window.
In larger environments, retention supports governance and planning. When you run a portfolio of locations, you want to answer questions like: “Did the new layout reduce congestion last quarter?” “Did the renovation increase dwell time?” “Did the new entry flow improve visitor distribution?” Those outcomes connect directly to smart spaces goals and broader capital planning.
A good analytics view helps a reader decide quickly.
Are people reaching the areas you expected?
Are they spending time there?
Are they returning?
Engagement views help distinguish between motion and presence. A corridor can be “busy” without being meaningful. A small zone can be “quiet” but high value if dwell time is strong.
Loyalty-style metrics, such as repeat visits, can help assess if people find value in the space. For campuses, that can reflect usage of student services or shared facilities. For retail, it can reflect store relevance and return behavior. For corporate offices, it can reflect the success of collaboration zones. This is where Meraki location analytics can serve as a shared language between IT and operations, providing measurable evidence rather than opinion.
Heatmaps are often the most intuitive starting point, because they translate movement into space. They show concentration, distribution, and persistence. In smart spaces, that has practical uses. If congestion concentrates near one entrance, you can adjust signage, routing, or service points. If visitors cluster near a display but do not progress, you can adjust the layout. If a waiting zone becomes a choke point, you can change seating or queue design.
Heatmaps also help validate changes. If you move a service desk, the heatmap should change. If you add a secondary pickup point, distribution should improve. The goal is not to stare at heatmaps all day. The goal is to use them as a decision tool, then confirm the impact.
Playback views help teams see the story of a day, not in marketing terms, but in operational terms.
When did the morning wave arrive?
When did lunch demand peak?
When did foot traffic drop?
When did a queue form, and how long did it persist?
Playback supports review meetings because it makes patterns visible.
Comparative analysis is even more valuable for multi-site estates. If two locations share similar size, hours, and population, differences in traffic behavior point to layout, staffing, or process gaps. At scale, campus analytics helps leaders compare buildings or zones and prioritize improvements based on measurable impact.

Analytics accuracy starts with coverage consistency. If the wireless design already has gaps, analytics will inherit those gaps. Aim for predictable coverage across the zones you want to measure. That includes entrances, lobbies, corridors, and waiting areas, not only desks and meeting rooms. You do not need to place an access point for analytics alone, but you should avoid leaving key zones “invisible.”
Placement matters even more in complex buildings. Concrete, metal shelving, and dense walls can distort signal patterns. In these environments, validate coverage with surveys and real device behavior. Meraki wireless tools can help you monitor client distribution and performance, but you still need good physical design practices.
Floor plans give context. Without them, analytics becomes abstract charts with no map to action. With floor plans, heatmaps, and zone analysis make sense to non-network teams. It becomes easier to say, “Traffic clusters near this checkout line,” instead of “Traffic clusters near AP-7.” That matters because most stakeholders think in space, not device names.
Geoalignment and careful mapping also reduce misinterpretation. If floor plans are outdated or scaled incorrectly, you can end up with misleading heat patterns. Treat floor plan management as part of operational hygiene. It is not glamorous, but it prevents bad decisions.
At scale, structure makes analytics usable. A clean network-per-site model tends to work well for most deployments. It keeps data scoped to real places. It simplifies permissions and reporting. It also reduces accidental mixing of traffic across unrelated areas.
For campuses or multi-building sites, you may choose a structure that maps networks to buildings or functional zones. The “right” model is the one that matches how teams operate. If facilities teams manage buildings separately, match that. If one team manages the entire campus as a single environment, keep it cohesive. Structure should support collaboration, not fight it.
Location analytics must be deployed responsibly. In most business use cases, teams do not need personal identity. They need patterns. Systems that anonymize identifiers and focus on aggregate behavior reduce risk and align better with privacy expectations. It also helps teams build trust with visitors and staff, which matters for long-term use.
Strong governance begins with purpose limitation. Define what the organization wants to measure, who can access the data, and how it will be used. Keep the scope operational. Avoid using analytics for surveillance-style decisions. The best deployments focus on flow, capacity, and experience.
Modern devices randomize identifiers to reduce tracking. That means raw device counts can be less stable than teams expect, especially in spaces with short visits. This is not a failure of the platform. It is a reality of modern privacy design. The practical approach is to focus on trends rather than exact counts. If foot traffic rises 20 percent week-over-week, that direction is meaningful even if absolute counts have noise.
To improve reliability, use consistent time windows and interpret metrics as indicators, not ground truth. Pair analytics with other data sources when needed. For example, a retail team might compare the direction of traffic trends with the direction of sales trends. A campus team might compare traffic trends with scheduled events.
Ethical deployment includes transparency. Use signage where appropriate. Communicate purpose in clear language. Limit access to analytics dashboards to teams with a defined need. Keep retention aligned with policy. When teams treat analytics as an operational tool, transparency becomes easier because the purpose is defensible.
If you build this foundation early, you reduce risk later. You also improve adoption inside the organization. Teams are more willing to use analytics when it is clearly governed and responsibly managed.
Retail teams use foot traffic analysis to improve staffing and layout. A common pattern is peak traffic that does not match staffing schedules. Another is long dwell time in one area with low conversion, which can signal bottlenecks or confusing flows. Location metrics can also help test changes. Adjust the queue design, then measure if dwell time in line drops. Move a promotion, then measure if the zone attracts more visitors.
The most effective retail use cases are practical. They focus on reducing friction and improving experience. They do not rely on perfect attribution. They rely on pattern shifts that teams can validate in daily operations.
In education and healthcare, analytics supports occupancy monitoring and space planning. Campuses can track peak usage of libraries, cafeterias, and student services. Healthcare facilities can use zone patterns to identify waiting area congestion and improve patient flow.
Corporate environments can use analytics to support hybrid work planning. If collaboration zones are consistently over capacity, you can adjust room scheduling or redesign space. If certain areas remain underused, you can repurpose them. This is where campus analytics becomes a planning tool instead of a network feature.
Events and venues face dynamic demand. Crowd movement shifts rapidly. A single chokepoint can cause safety and experience issues. Real-time location data helps teams react faster. If one entrance becomes overloaded, staff can redirect attendees to another entrance. If a concession area becomes congested, teams can open another service point.
For public spaces, analytics supports planning and resourcing. It can help justify staffing levels and improve visitor routing. In these deployments, clear privacy practices matter even more because audiences are broad and expectations are high.
As teams mature, they often want to pull analytics into broader reporting. An API-driven approach can support weekly performance reporting, portfolio comparisons, and operational dashboards. This is helpful for organizations that already use BI tools or centralized reporting platforms.
The key is to define what you export and why. Exporting everything creates noise. Exporting the metrics tied to decisions creates value. For example, a retail team might export hourly visitors and dwell time by zone. A campus team might export building occupancy trends by day.
Analytics becomes more powerful when paired with outcomes. Retail might compare traffic with sales and staffing. Education might compare traffic with event schedules. Corporate might compare occupancy with badge access trends. The goal is not to force “perfect correlation.” The goal is to improve decision quality.
This is also where smart spaces initiatives gain traction. Leaders can justify space changes and operational changes with evidence. IT becomes a partner in outcomes, not only a support function.
Scaling depends on consistency. Consistent AP naming, consistent network structure, consistent floor plan management, and consistent governance. Without that, cross-site comparisons become unreliable. With it, analytics becomes a fleet-level capability.
If you run many sites, standardize your analytics playbook. Define how you classify zones. Define which metrics matter. Define how teams review results. Consistency turns analytics into routine operations, not a one-time project.
Many failures come from design shortcuts. Poor placement leads to blind zones. Outdated floor plans lead to misleading heatmaps. Teams sometimes treat analytics as a plug-in feature and are disappointed when the data does not match reality. Analytics needs baseline wireless hygiene. Coverage consistency, realistic expectations, and a clear map matter.
The other mistakes are organizational. Teams sometimes chase vanity metrics instead of decision metrics. They also sometimes skip governance, then lose stakeholder trust. Keep the focus on operational improvements. Use trends, not individual device stories. Communicate purpose clearly. When analytics is tied to outcomes, adoption becomes easier and long-term value becomes real.
Used well, Meraki location analytics can turn wireless infrastructure into a measurement layer for operations. It supports Wi-Fi analytics that help teams see traffic patterns, reduce congestion, and plan space with evidence. It supports occupancy monitoring for campuses, offices, and venues that need safer, smoother flow. It supports location-based analytics that help teams compare zones, validate changes, and scale insight across multiple sites. The strongest results come when analytics is designed into the wireless plan from the beginning, then governed with clear ownership and purpose.
Stratus Information Systems helps organizations build Meraki wireless environments that support accurate analytics while keeping privacy, operations, and maintainability in view. If your team wants to improve traffic measurement, validate space changes, or build a repeatable analytics model across sites, Stratus Information Systems can help you plan the deployment and the operating playbook so the data stays useful long after go-live.